The 2024 Health Equity Index (formerly SocioNeeds Index), created by Conduent Healthy Communities Institute, is a measure of socioeconomic need that is correlated with poor health outcomes. The index is part of Conduent's SocioNeeds Index® Suite, which provides analytics around social determinants of health to advance equitable outcomes for a range of topics.
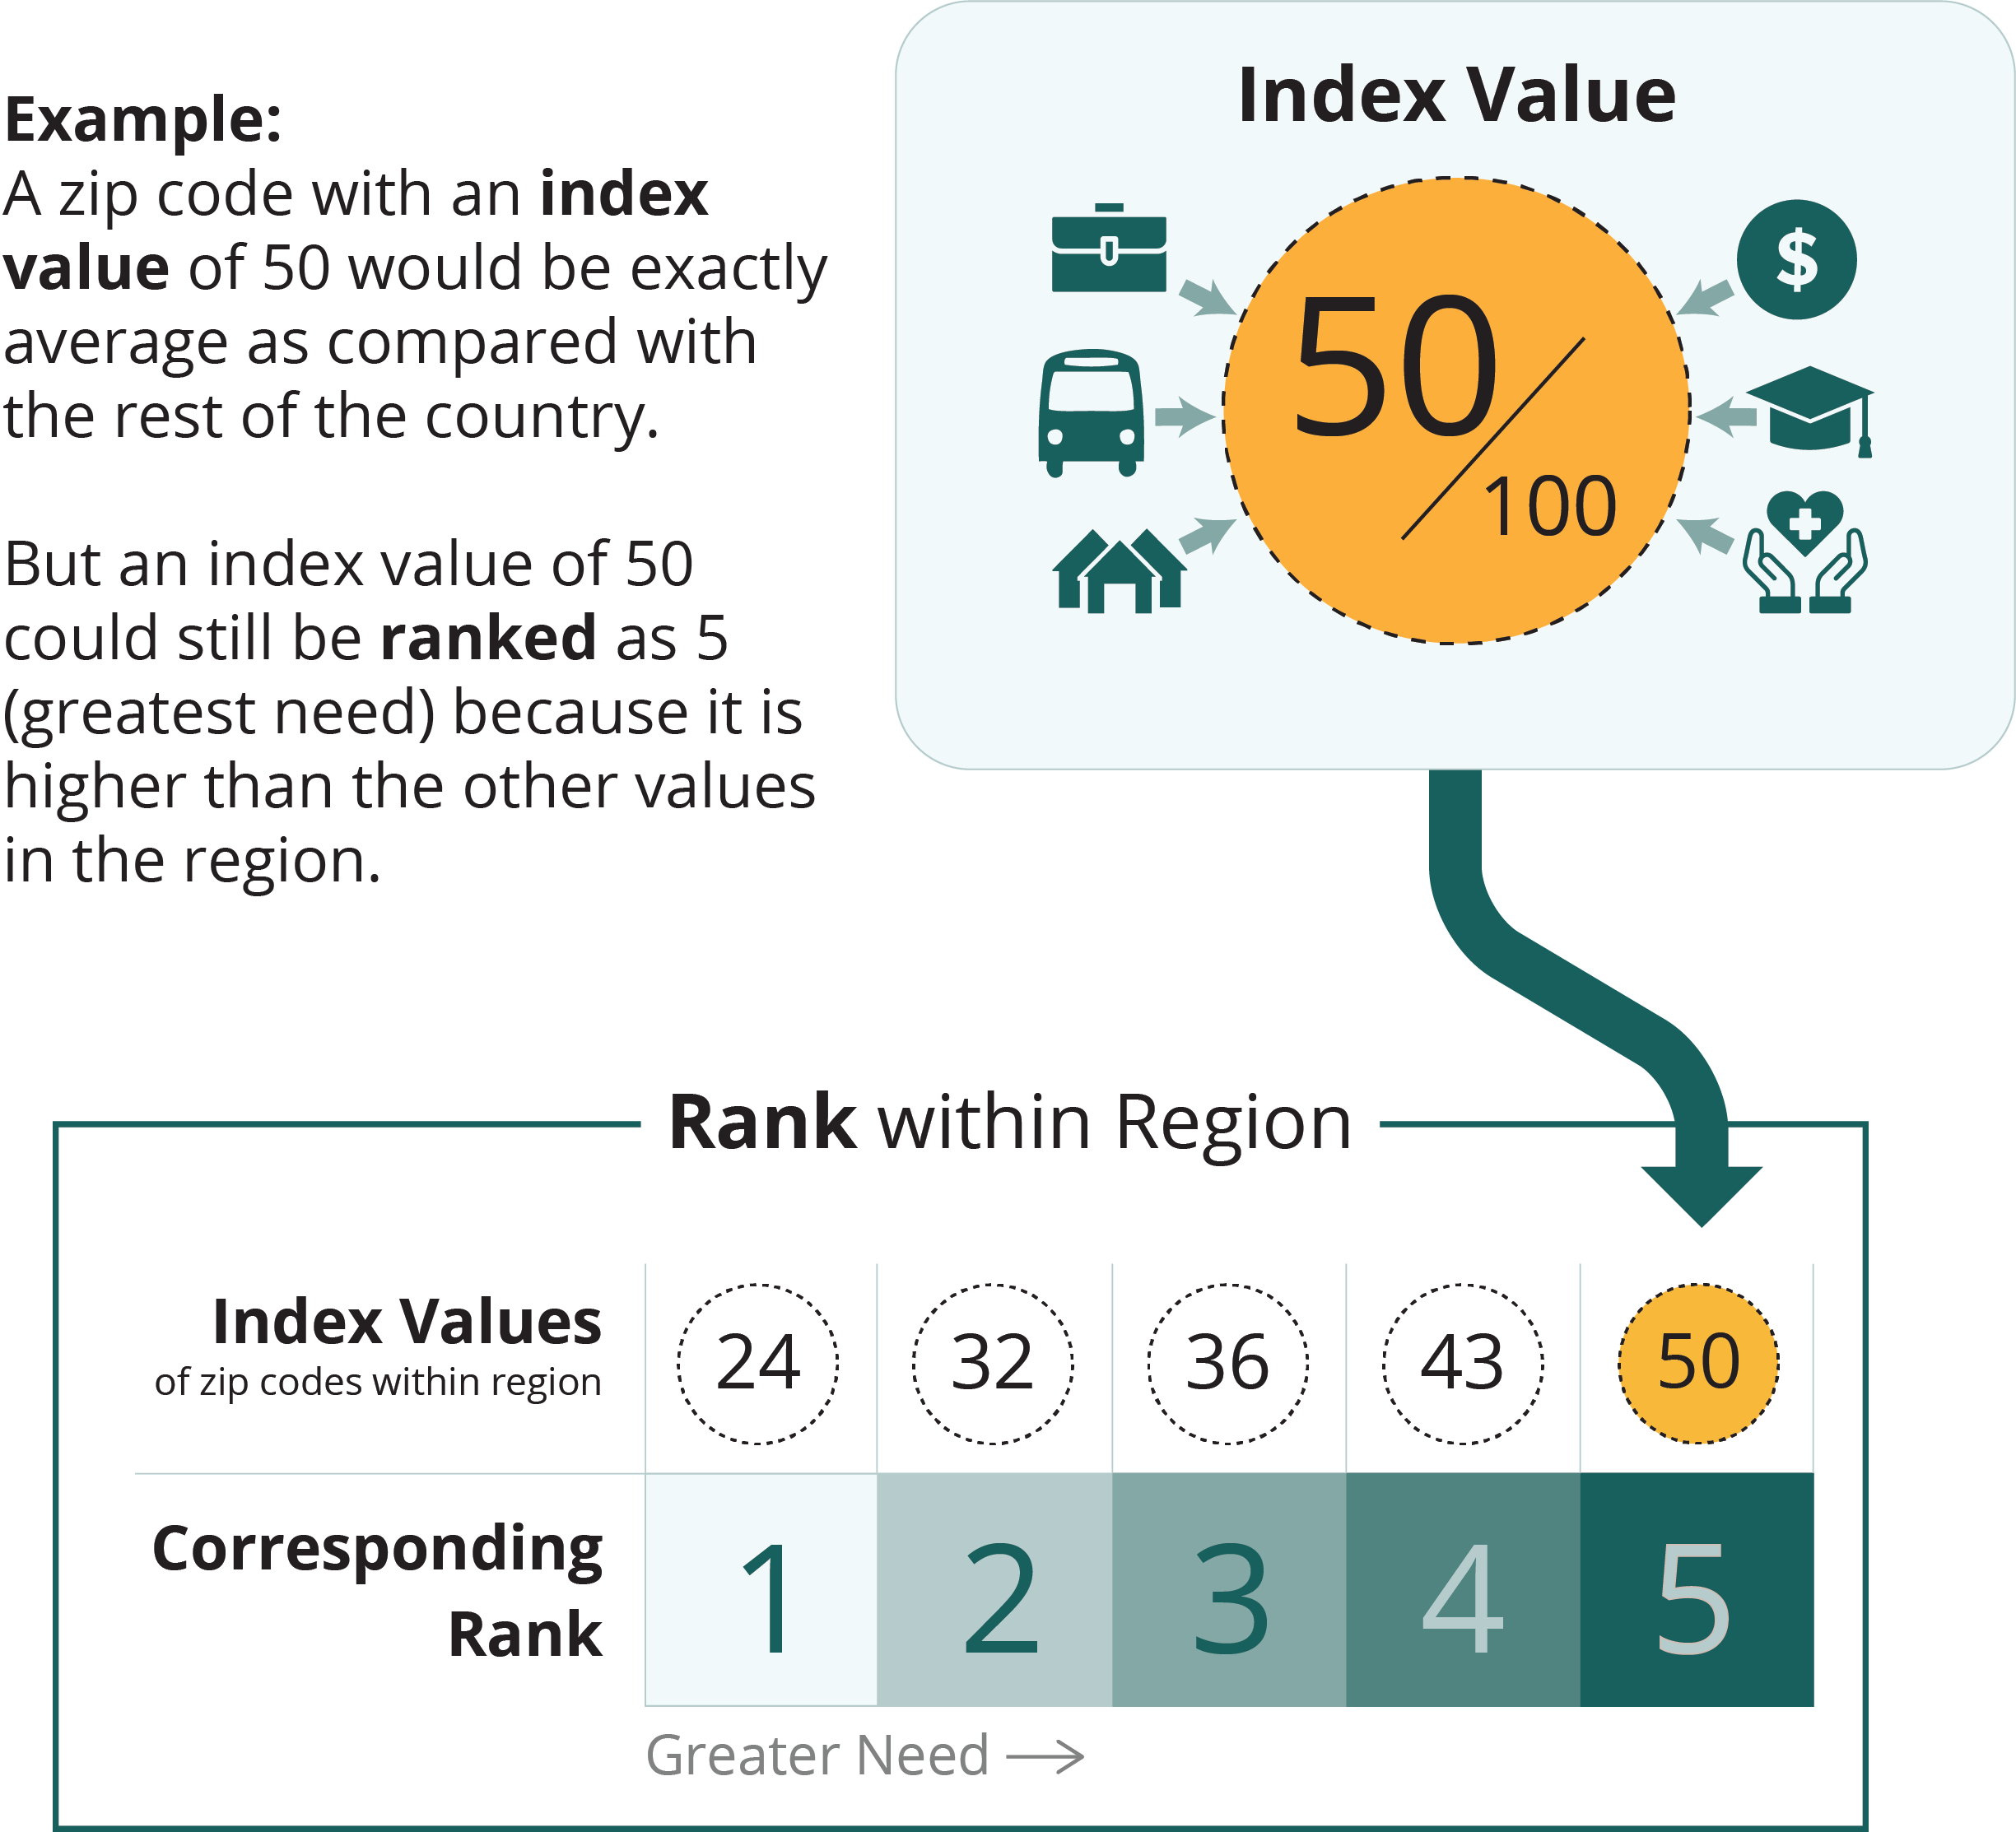
All zip codes, counties, and county equivalents in the United States are given an index value from 0 (low need) to 100 (high need). To help you find the areas of highest need in your community, the selected locations are ranked from 1 (low need) to 5 (high need) based on their index value relative to similar locations within the region.

map legend
greater need


| Zip Codesort column | Indexsort column | Ranksort column | Countysort column |
|---|---|---|---|
| 37342 | 93.6 | 5 | Coffee |
| 37240 | 89.5 | 5 | Davidson |
| 37183 | 79.4 | 5 | Bedford |
| 37080 | 72.4 | 5 | Davidson |
| 37184 | 72.2 | 5 | Wilson |
| 37207 | 70.1 | 5 | Davidson |
| 37160 | 69.8 | 5 | Bedford |
| 37217 | 66.9 | 5 | Davidson |
| 37210 | 62.1 | 4 | Davidson |
| 37018 | 58.0 | 4 | Coffee |
| 37355 | 55.9 | 4 | Coffee |
| 37208 | 55.5 | 4 | Davidson |
| 37013 | 53.8 | 4 | Davidson |
| 37360 | 53.8 | 4 | Coffee |
| 37090 | 50.7 | 4 | Wilson |
| 37211 | 49.4 | 4 | Davidson |
| 37218 | 48.2 | 4 | Davidson |
| 37206 | 45.0 | 4 | Davidson |
| 37020 | 44.3 | 4 | Bedford |
| 37388 | 44.0 | 4 | Coffee |
| 37086 | 38.4 | 3 | Rutherford |
| 37203 | 35.3 | 3 | Davidson |
| 37228 | 34.1 | 3 | Davidson |
| 37149 | 34.0 | 3 | Rutherford |
| 37180 | 33.9 | 3 | Bedford |
| 37115 | 33.6 | 3 | Davidson |
| 37072 | 32.1 | 3 | Davidson |
| 38476 | 30.4 | 3 | Williamson |
| 37189 | 30.3 | 3 | Davidson |
| 37167 | 30.1 | 3 | Rutherford |
| 37153 | 29.0 | 3 | Rutherford |
| 37138 | 27.9 | 3 | Davidson |
| 37076 | 27.6 | 3 | Davidson |
| 37062 | 27.0 | 3 | Williamson |
| 37118 | 26.5 | 3 | Rutherford |
| 37087 | 25.8 | 3 | Wilson |
| 37085 | 24.3 | 2 | Rutherford |
| 37209 | 21.8 | 2 | Davidson |
| 37214 | 19.9 | 2 | Davidson |
| 37216 | 17.7 | 2 | Davidson |
| 37132 | 17.5 | 2 | Rutherford |
| 37219 | 16.6 | 2 | Davidson |
| 37037 | 16.0 | 2 | Rutherford |
| 37129 | 15.8 | 2 | Rutherford |
| 37122 | 15.5 | 2 | Wilson |
| 37221 | 11.2 | 1 | Davidson |
| 37127 | 10.7 | 1 | Rutherford |
| 37201 | 10.3 | 1 | Davidson |
| 37130 | 9.8 | 1 | Rutherford |
| 37060 | 9.5 | 1 | Rutherford |
| 37174 | 8.5 | 1 | Williamson |
| 37014 | 8.0 | 1 | Williamson |
| 37128 | 7.7 | 1 | Rutherford |
| 37212 | 4.7 | 1 | Davidson |
| 37179 | 4.6 | 1 | Williamson |
| 37064 | 3.9 | 1 | Williamson |
| 37046 | 3.0 | 1 | Williamson |
| 37135 | 2.8 | 1 | Williamson |
| 37204 | 2.5 | 1 | Davidson |
| 37205 | 2.4 | 1 | Davidson |
| 37067 | 2.1 | 1 | Williamson |
| 37069 | 1.9 | 1 | Williamson |
| 37215 | 1.6 | 1 | Davidson |
| 37220 | 1.6 | 1 | Davidson |
| 37027 | 0.9 | 1 | Williamson |
Data Source
The Health Equity Index is calculated by Conduent Healthy Communities Institute using data from Claritas Pop-Facts®, 2024 and Claritas Consumer Profiles, 2023.
Technical Note
Index values are not comparable across measurement periods. Index values and rankings are specific to a measurement period, showing the relative ranking of a location in comparison to other similar locations at that time.